Hospitals in Knoxville region
No more data
July 27, 2023: The data sources I was using for this site are no longer being updated. The only remaining sources seem to be sewage data; CDC has it https://covid.cdc.gov/covid-data-tracker/#wastewater-surveillance but it’s all relative (Covid levels in sewage versus the highest at any point at that site, but sites came online at different times). Biobot Analytics has data on absolute numbers through time (as well as variants) https://biobot.io/data/covid-19 but they no longer have freely accessible raw data. Even hospitals release data only sporadically and incompletely now. I might poke around later to see what’s available but for now I’m not updating this site.
Old site
The Knox County Health Department puts out information on hospital capacity in their region, which is Anderson, Bledsoe, Blount, Bradley, Campbell, Carter, Claiborne, Cocke, Cumberland, Grainger, Greene, Hamblen, Hamilton, Hancock, Hawkins, Jefferson, Johnson, Knox, Loudon, Marion, McMinn, Meigs, Monroe, Morgan, Polk, Rhea, Roane, Scott, Sevier, Sullivan, Unicoi, Union, Washington Counties; there are 19 hospitals in this region with potential ICU beds.
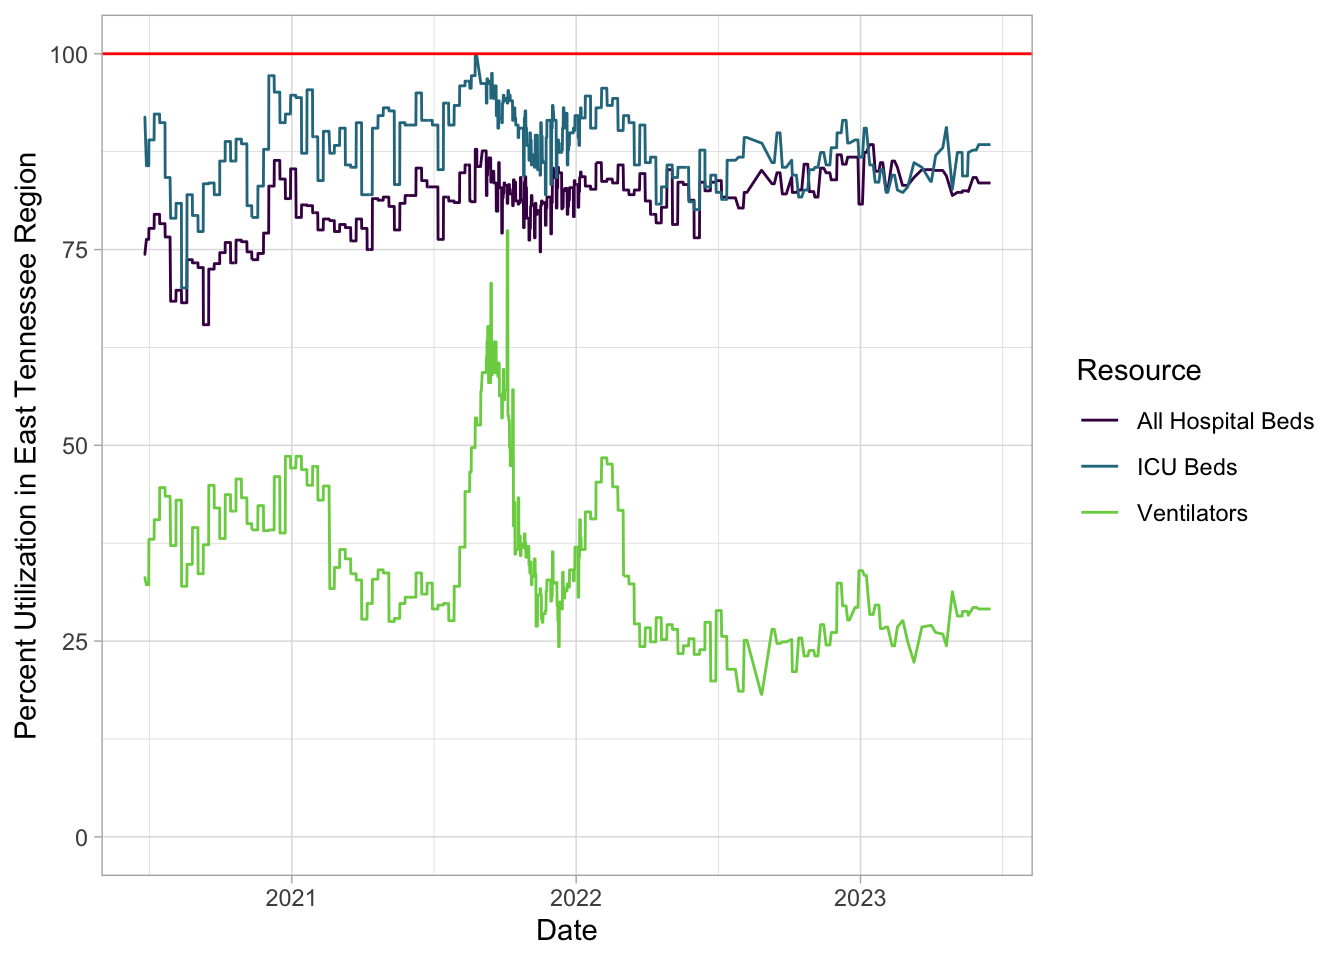
As of the last time the data were updated, regional hospitals had 18 ICU beds available of 301 total, and 297 available ventilators out of 419 total, (29 percent capacity). The hospitals overall had 216 beds available of 2526 total (so was at 91 percent capacity). This is based on 19 acute care hospitals in the East TN region. When a line hits 100% (indicated in red), the local hospitals are theoretically full for that resource (for all patients, not just covid patients), though there is surge capacity on top of this. Note that these data are updated only twice a week, so current conditions maybe be much better or worse than these plots show. Data on capacity from Knox County’s dashboard, using their percent utilization metric.
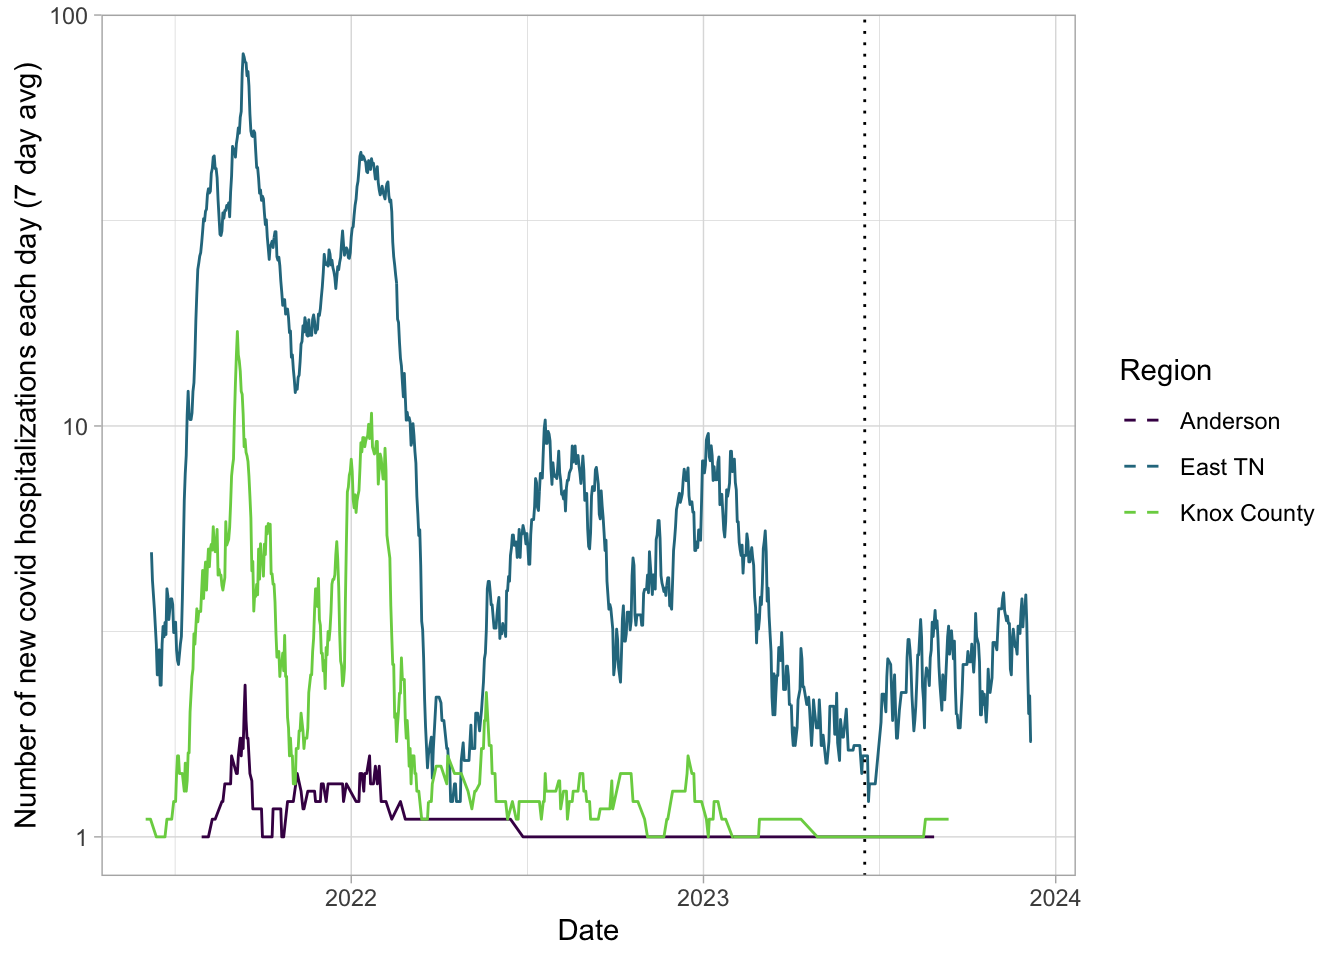
Trends in hospitalization of covid patients over time. The vertical dotted line shows the last day with updated capacity information from Knox County, when there were 18 ICU beds available (ignoring surge capacity) for people in the East Tennessee region. The seven day average is shown. This is on a log10 scale so the 2021 spike doesn’t obscure other patterns.