Oak Ridge Schools
No more data
July 27, 2023: The data sources I was using for this site are no longer being updated. The only remaining sources seem to be sewage data; CDC has it https://covid.cdc.gov/covid-data-tracker/#wastewater-surveillance but it’s all relative (Covid levels in sewage versus the highest at any point at that site, but sites came online at different times). Biobot Analytics has data on absolute numbers through time (as well as variants) https://biobot.io/data/covid-19 but they no longer have freely accessible raw data. Even hospitals release data only sporadically and incompletely now. I might poke around later to see what’s available but for now I’m not updating this site.
Old site
2022-2023
For the 2022-2023 school year, Oak Ridge Schools are not reporting details of covid incidence or requiring any mitigation measures.
2021-2022
Oak Ridge Schools were releasing information on cases in schools from August 2021 to mid-March 2022. You can also get information at https://www.oakridger.com/ and https://oakridgetoday.com/.
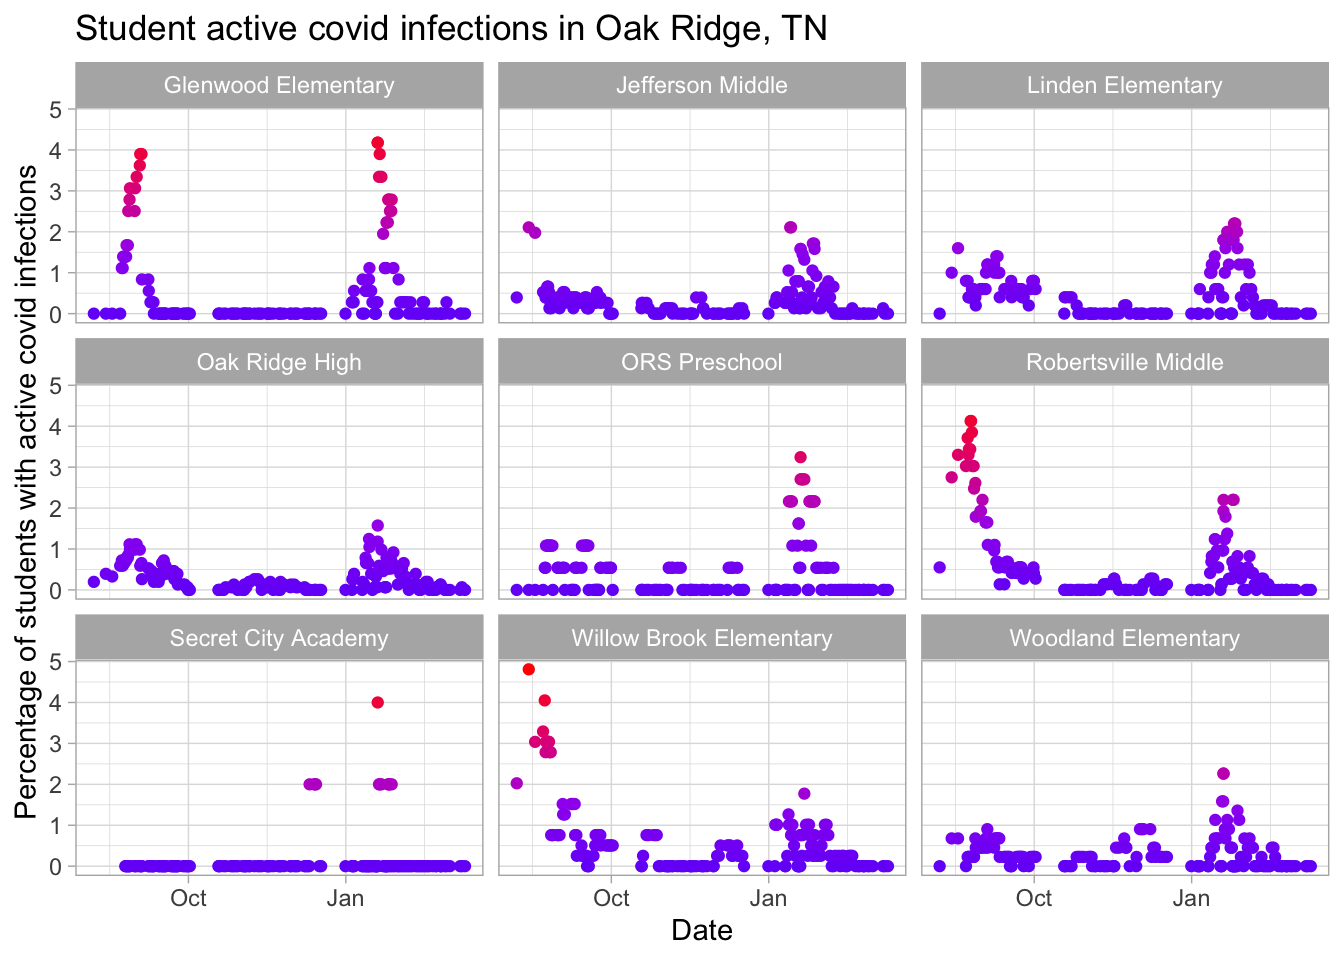
The plot below shows the proportion of students with active covid cases at any one time over the 2021-2022 school year.
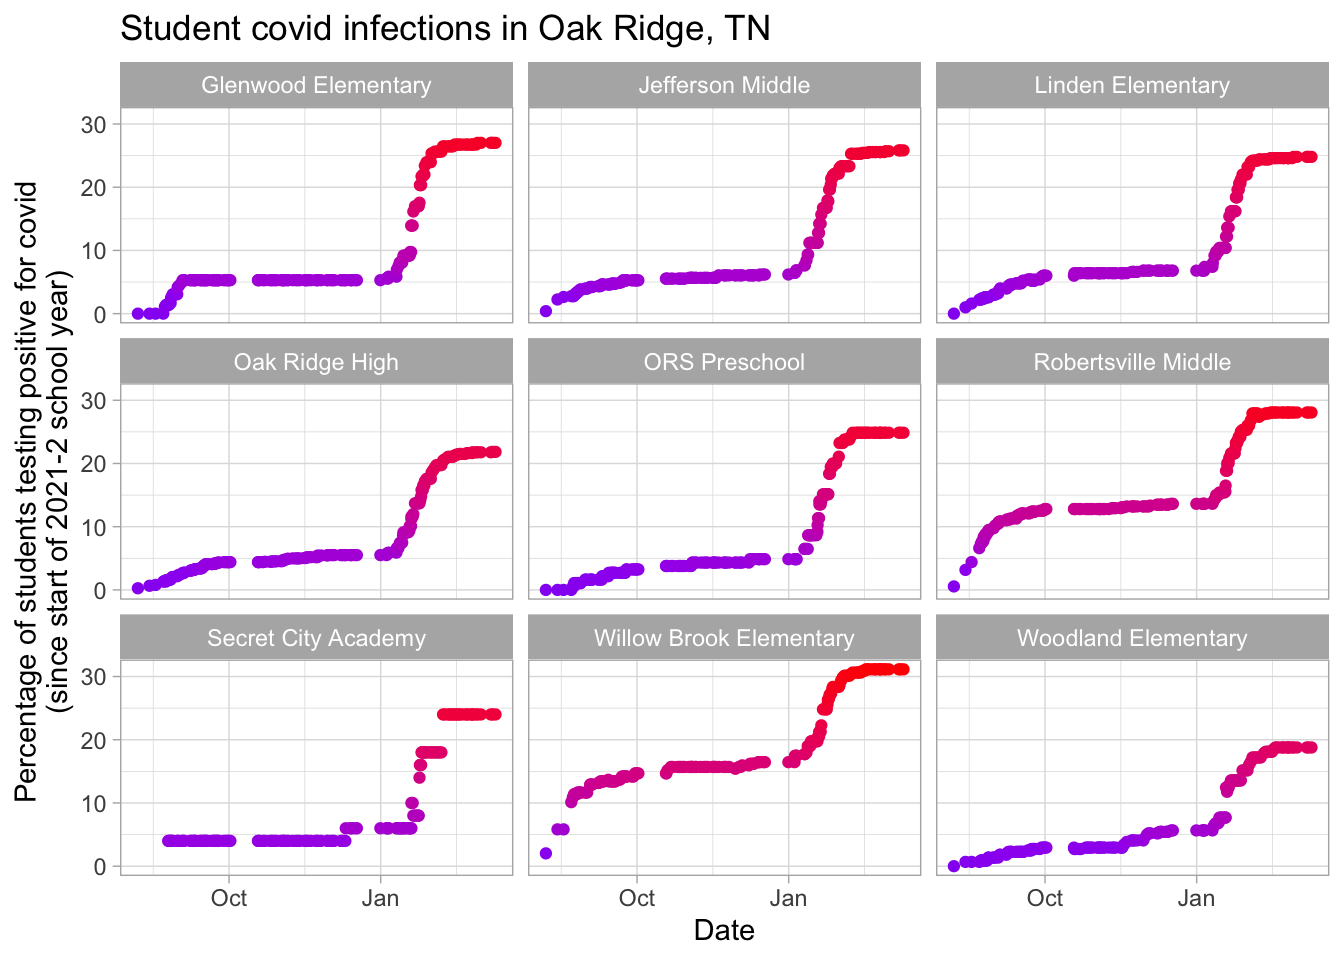
What percentage of students in a school have gotten covid over the 2021-2022 year alone? Note that this assumes each student gets covid no more than once. However, a bout of covid gives only partial immunity, so some students may have had covid more than once.