Travel
No more data
July 27, 2023: The data sources I was using for this site are no longer being updated. The only remaining sources seem to be sewage data; CDC has it https://covid.cdc.gov/covid-data-tracker/#wastewater-surveillance but it’s all relative (Covid levels in sewage versus the highest at any point at that site, but sites came online at different times). Biobot Analytics has data on absolute numbers through time (as well as variants) https://biobot.io/data/covid-19 but they no longer have freely accessible raw data. Even hospitals release data only sporadically and incompletely now. I might poke around later to see what’s available but for now I’m not updating this site.
Old site
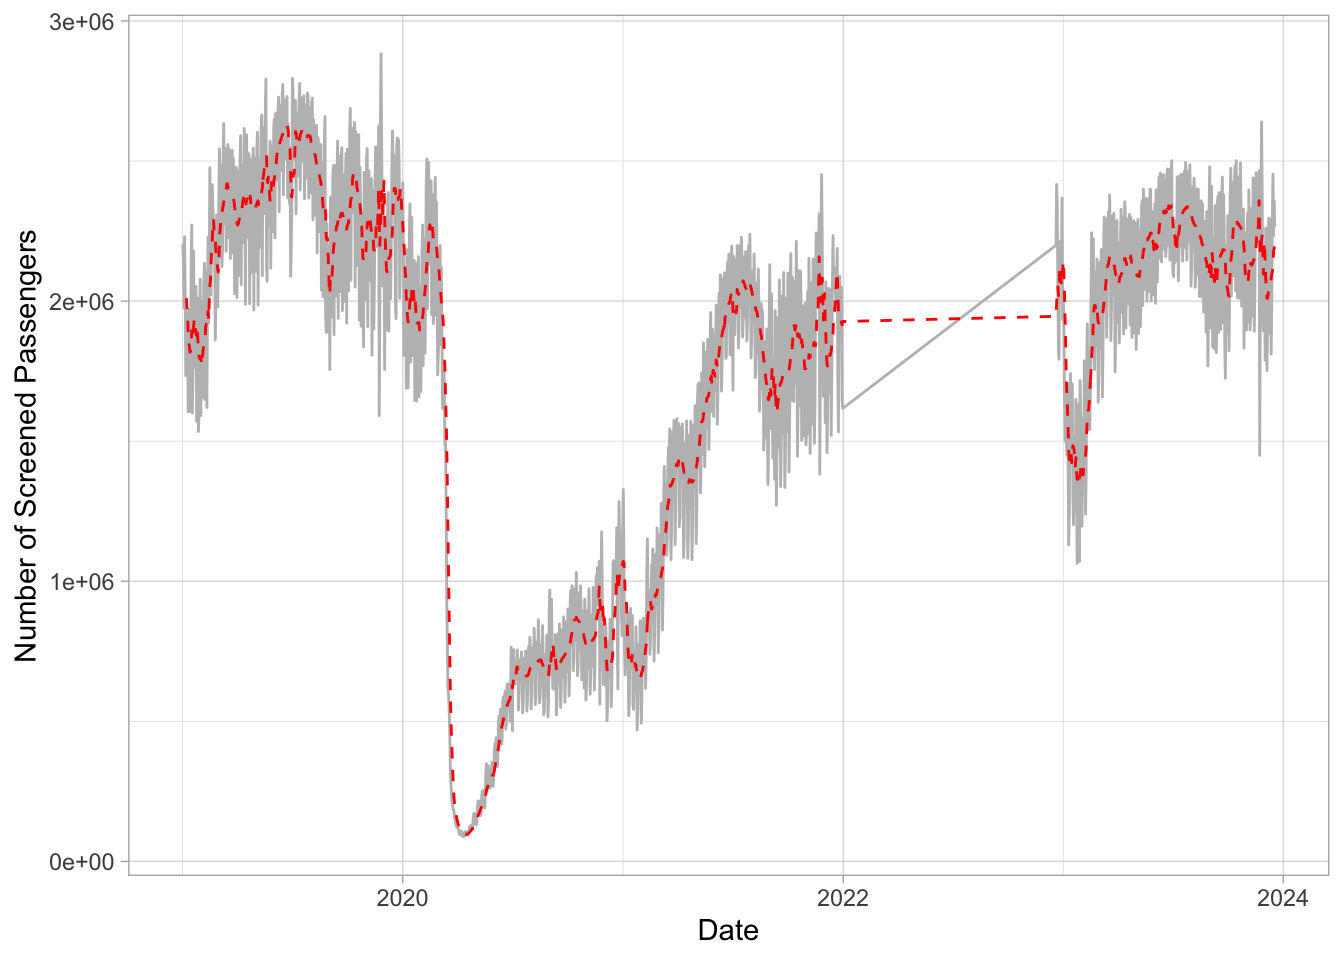
Here are TSA screenings nationwide over time, pulled from https://www.tsa.gov/coronavirus/passenger-throughput. Gray for daily data, red for seven day average.
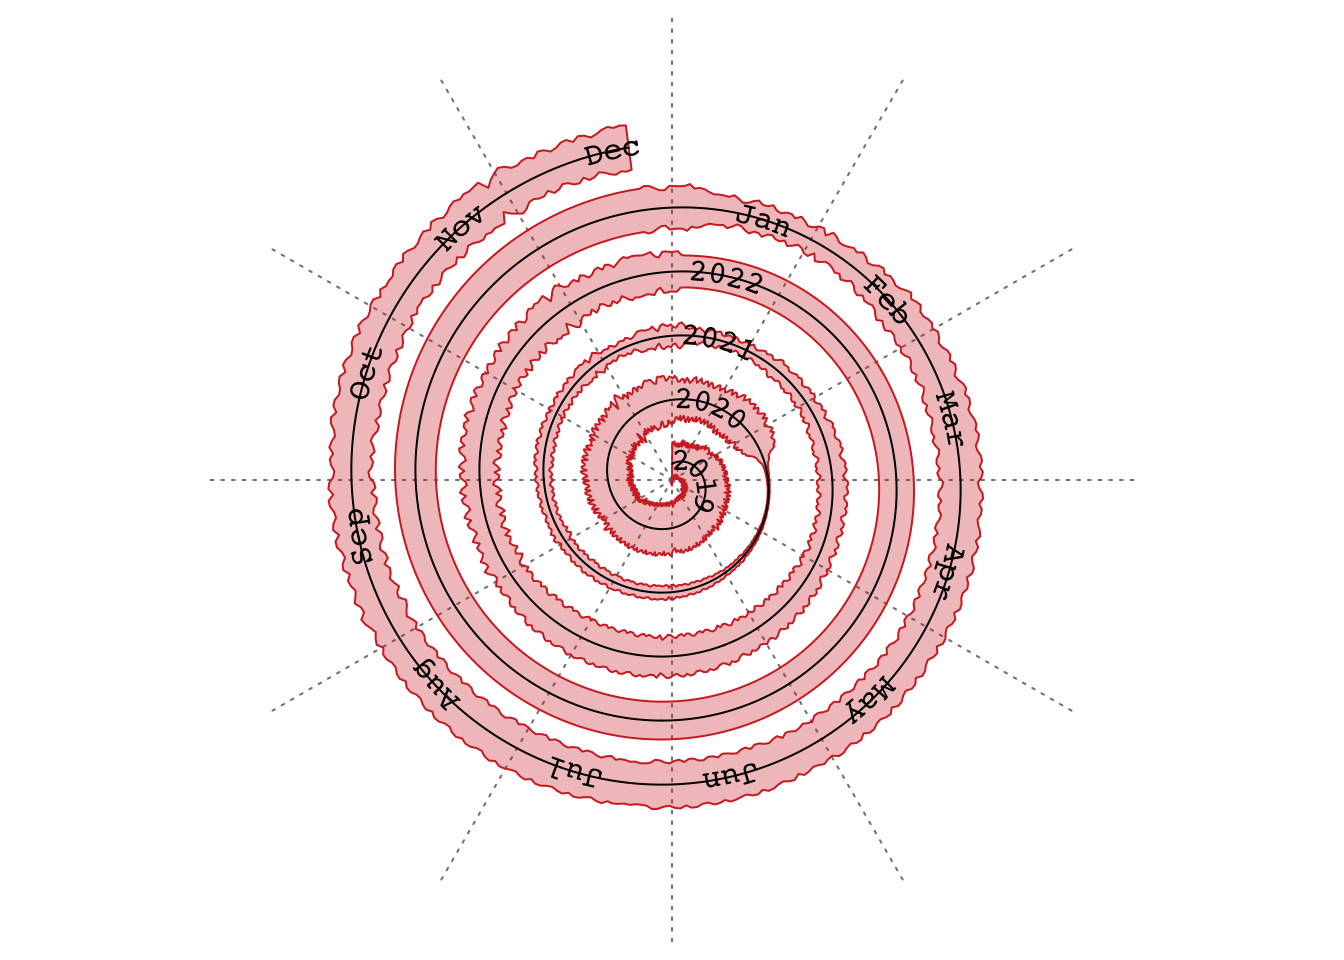
Plotting on a spiral plot to compare similar high travel times:
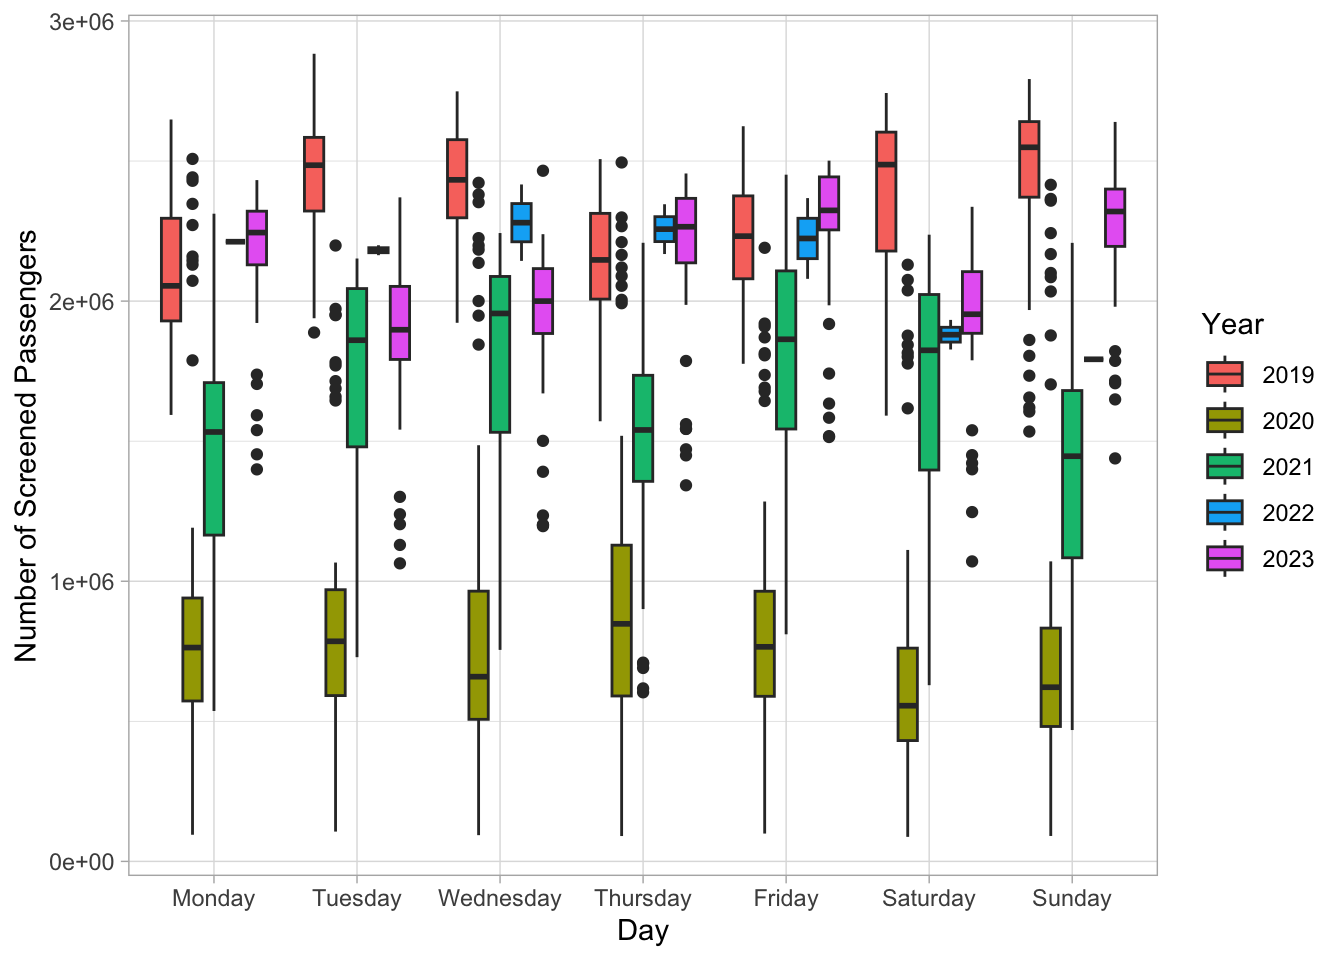
Travel volume differs by day of week.