Year Comparison
No more data
July 27, 2023: The data sources I was using for this site are no longer being updated. The only remaining sources seem to be sewage data; CDC has it https://covid.cdc.gov/covid-data-tracker/#wastewater-surveillance but it’s all relative (Covid levels in sewage versus the highest at any point at that site, but sites came online at different times). Biobot Analytics has data on absolute numbers through time (as well as variants) https://biobot.io/data/covid-19 but they no longer have freely accessible raw data. Even hospitals release data only sporadically and incompletely now. I might poke around later to see what’s available but for now I’m not updating this site.
Old site
Comparing year by year
In the over 20 months since covid started spreading we have learned a lot: vaccines are now available (in the US), we know masks help, and so forth. However, the virus continues to evolve, too.
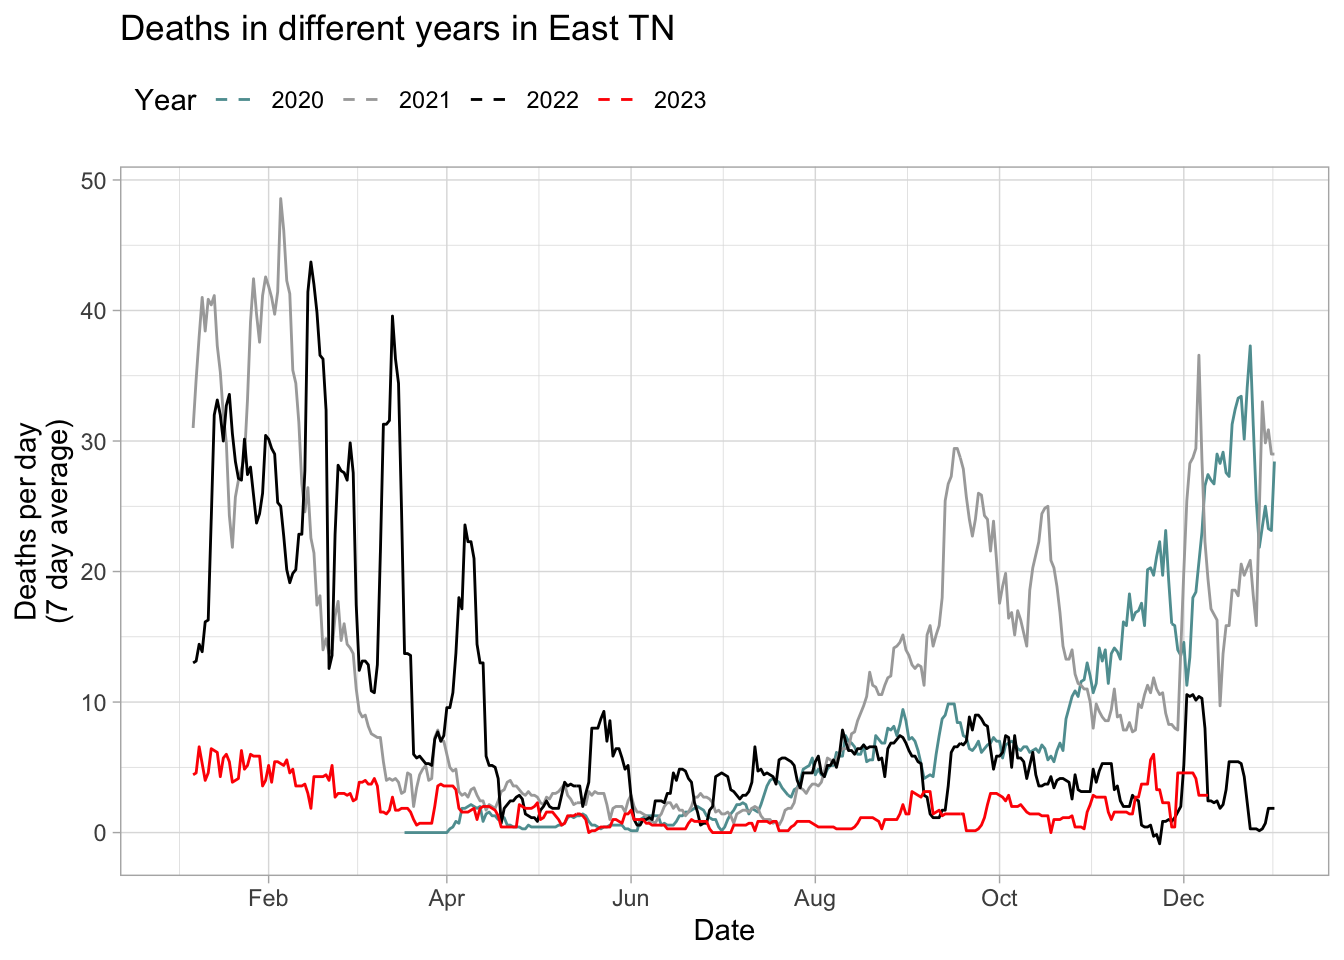
Deaths over time across all individuals (excluding Dec 22, 2021, when there seems to be an error in the state’s death records):
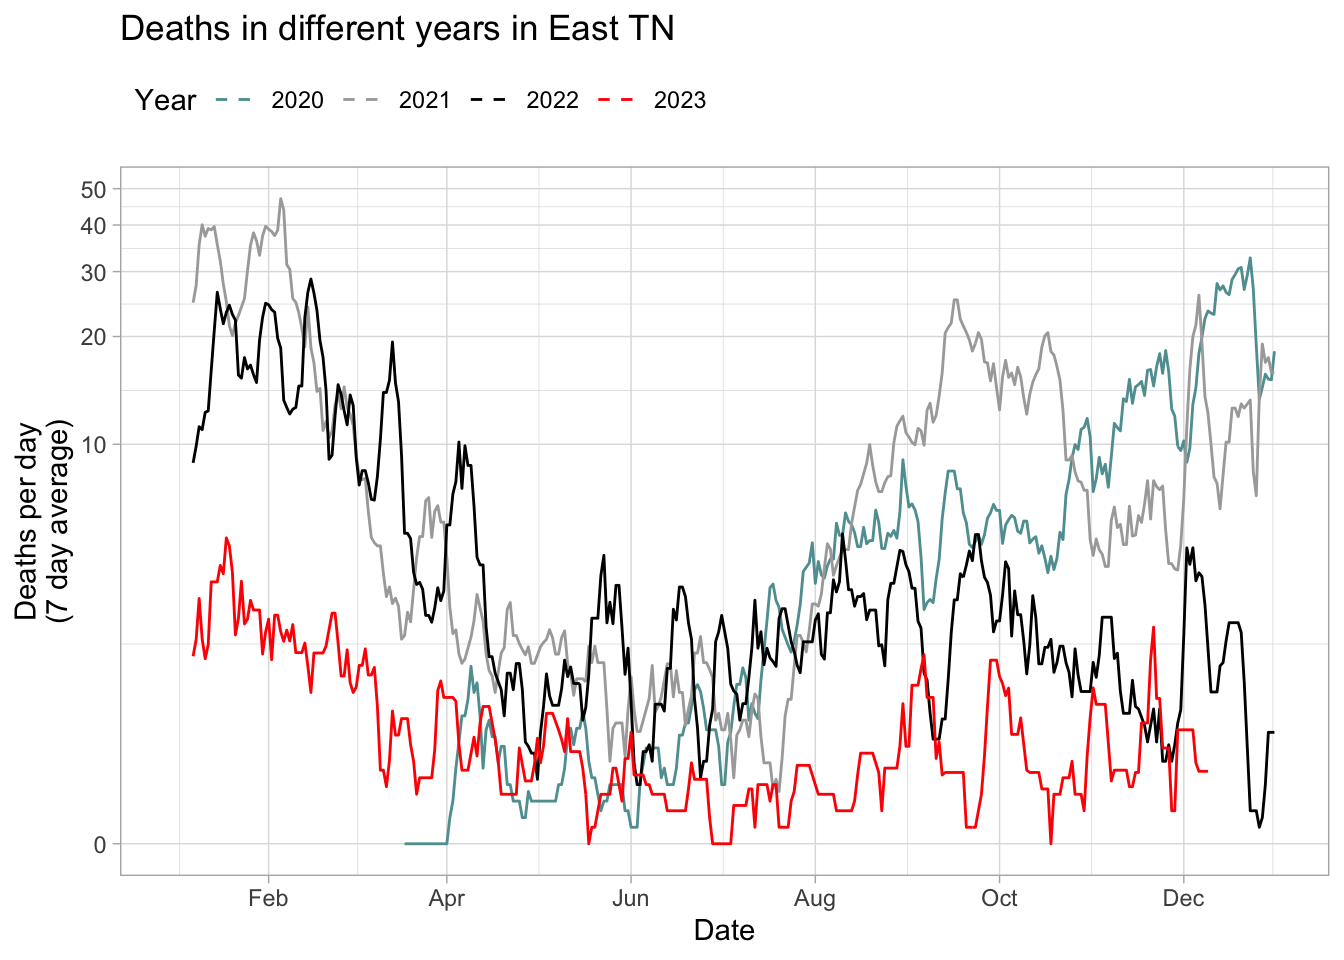
Or on a log scale:

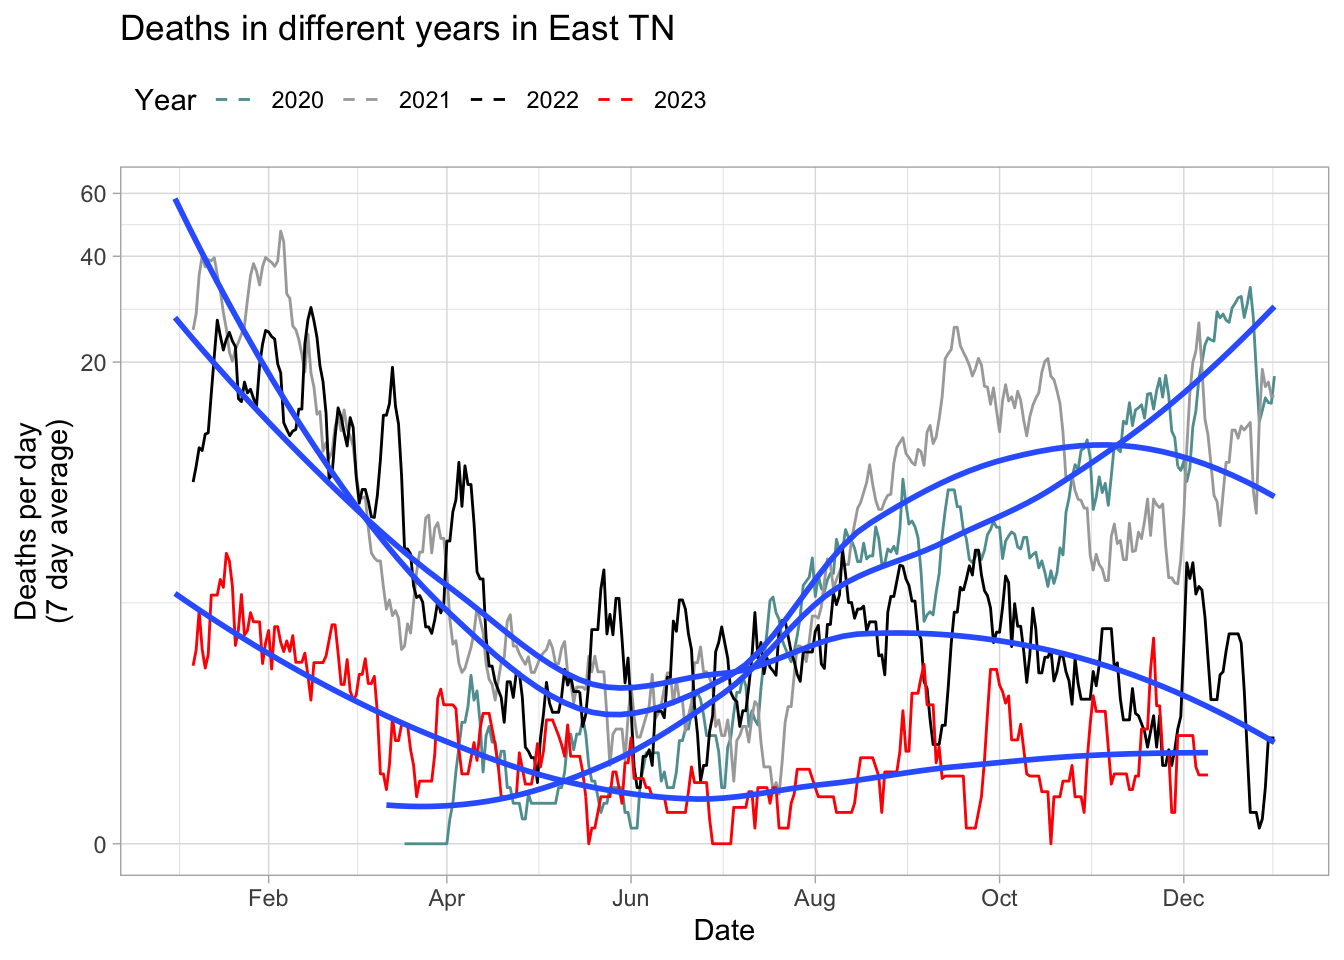
And with a trend line
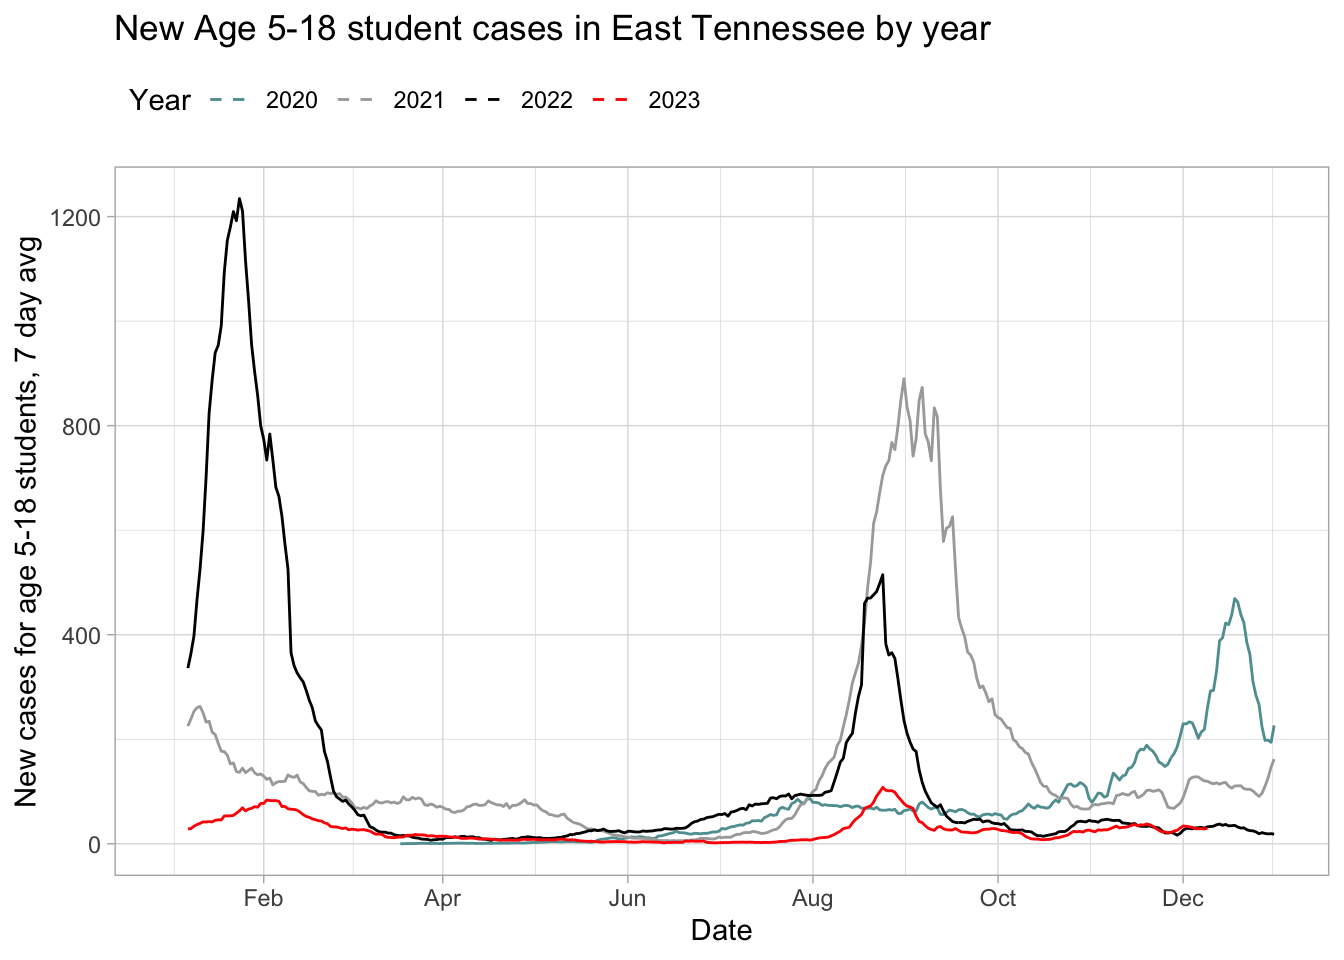
We can see how students age 5-18 (so equivalent to K-12, generally) have had positive cases in East Tennessee.
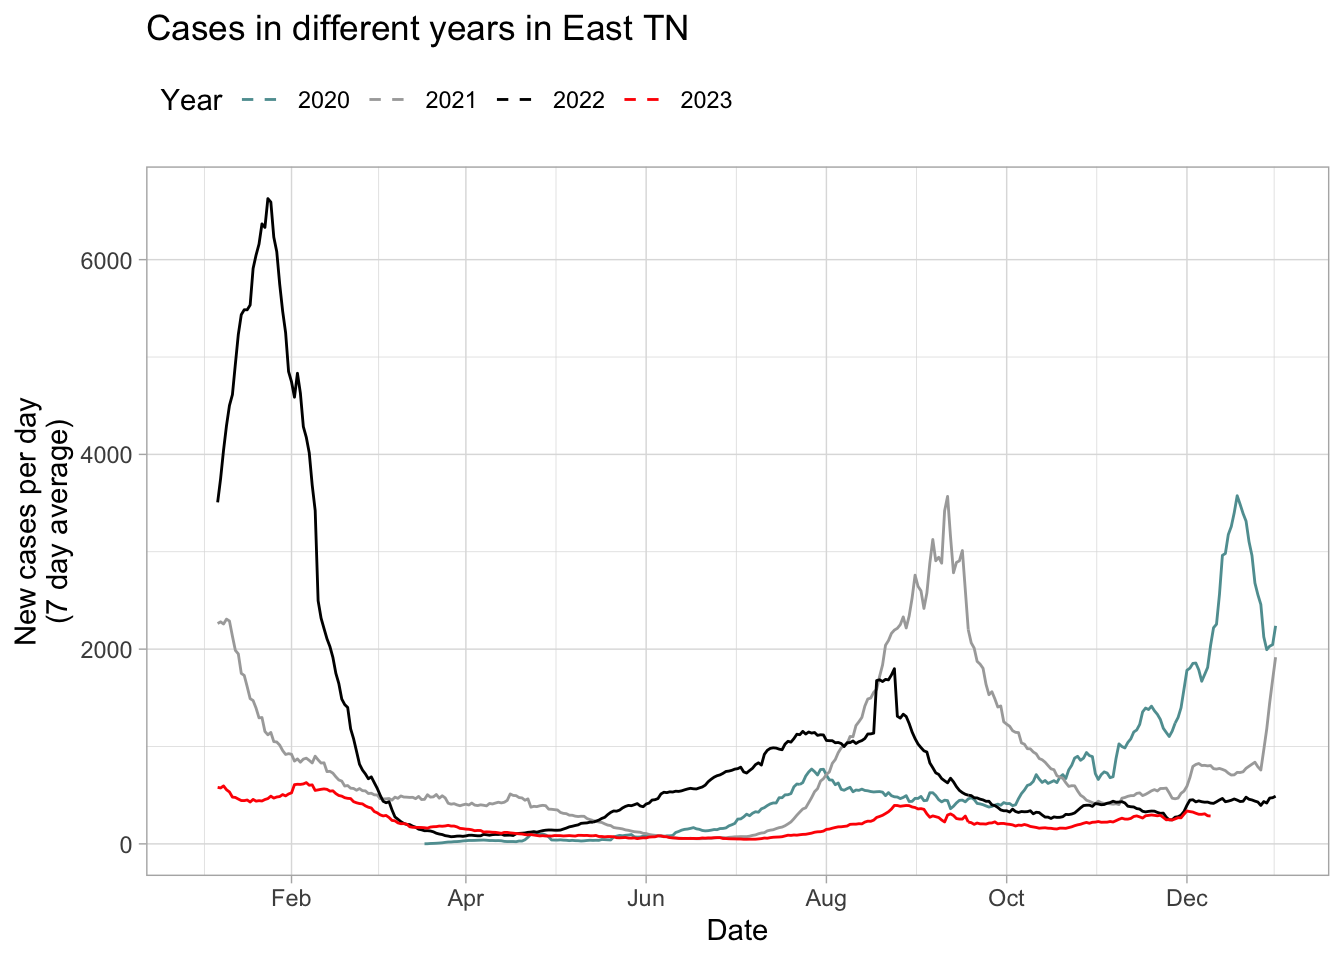
Or positive covid cases across all individuals: